Mirant Graphitization Study
Mirant provided 6 boiler tubes to TesTex that were suspected of containing graphitization. Four of the tubes were removed from Bowline Station and two were removed from the Pittsburgh Station. The Balanced Field Electromagnetic Technique (BFET) was used to examine the tube samples. Curved OD Hawkeye DP probes along with a 45˚ Hawkeye DP probe were used with the Prodigy II Electronics (serial #09-3118-04)
With the technology based on electromagnetics, a polished surface is not required. Quality readings can be acquired through coatings such as paint, epoxy, and rubber. The actual probe does not need to be in contact with the test piece. Sometimes the probe is placed in a small cart with the probe base set slightly above the test piece. The probe can be pulled quickly across the test specimen at a speed up to 1 foot per second. The BFET method can test different types of metal by adjusting the test frequencies which range from 100HZ to 30,000HZ.
During an inspection, the data is viewed in real-time on a computer screen. This allows defects to be found and located during the data collection process which allows a plant to quickly prove-up any suspect defects and to schedule repairs without having to wait for the completion of the job.
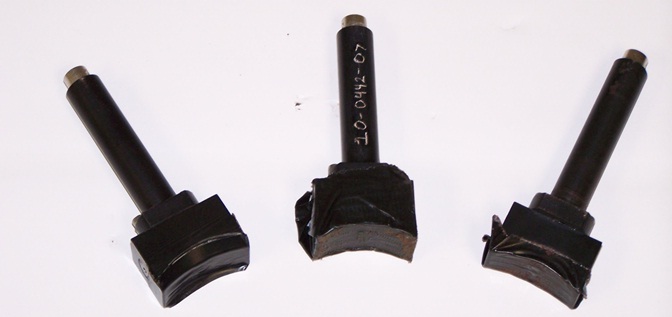
The picture above shows various OD Hawkeye DP probes used to test the samples. The handle on the probe can be modified to fit the probe into tight areas.
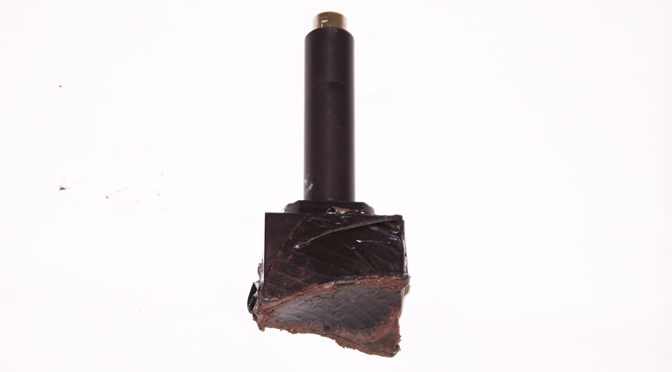
The picture above shows the 45˚ HawkeyeDP.
Indications 3, 6, and 8 showed the strongest signal response.
Indications 1 and 5 gave a moderate signal response.
Indications 2, 4, and 7 gave a small but distinguishable signal response.
A Metallurgical evaluation was performed on all eight indications and graphitization was found in each area. The table below lists the results of the metallurgical evaluation.
The table above shows the metallurgical evaluation results.
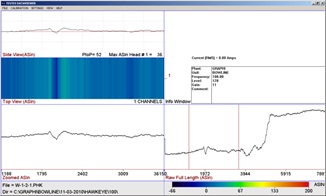
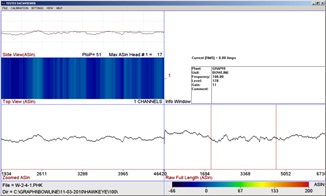
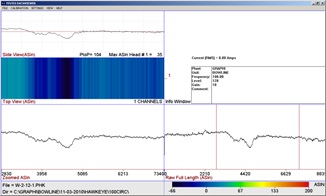
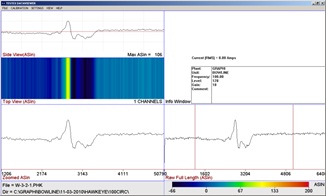
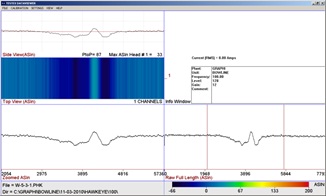
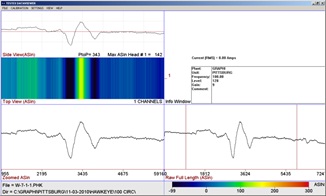
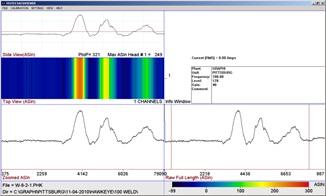
The waveform above is from indication 1 that was collected using a 45˚ Hawkeye DP.
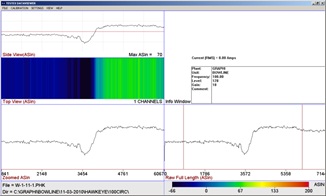
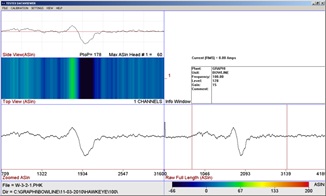
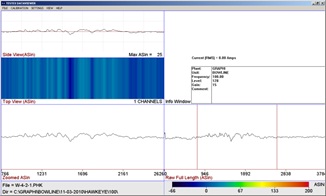
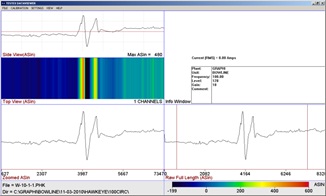
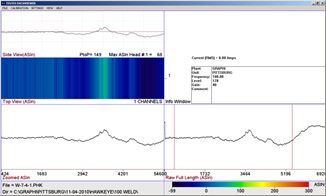
The waveform above is from indication 1 that was collected using a circumferential Hawkeye DP.
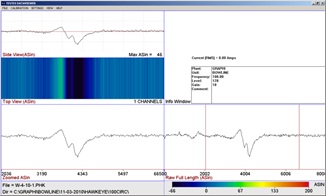
The Balanced Field Electromagnetic Technique (BFET) waveform is displayed in (5) different windows. The bottom right window is the raw data. The bottom left window shows the data processed. The middle left window is a simulated C-scan. The top left window is a zoomed in view of the data and the top right window shows a color-coded 3D view of the data. Any sharp crack-like defects will cause the waveform to rise up/down sharply.
grap1-5.jpg
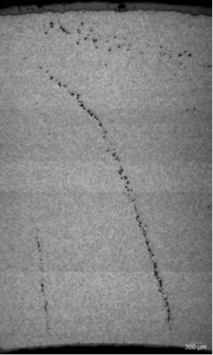
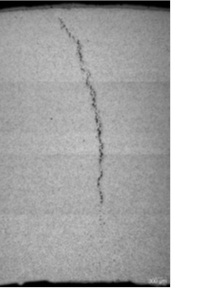
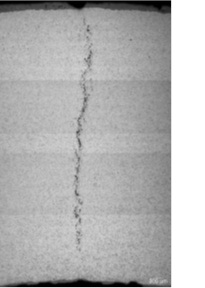
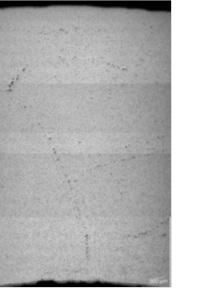
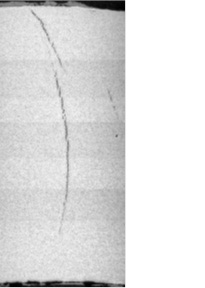
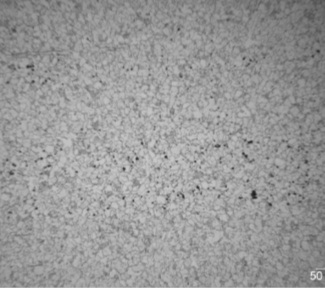
The picture above is a traverse section from Indication 1 with chained graphitization at the 11 and 1 o’clock positions.
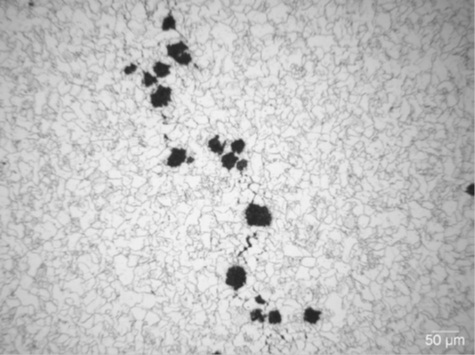
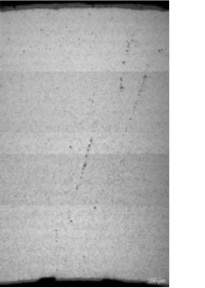
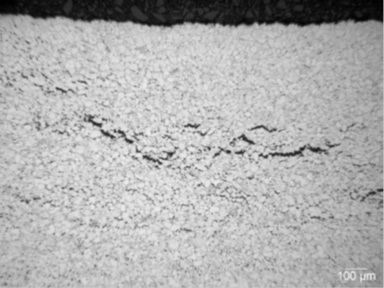
The picture above is from Indication 1 showing chained graphitization at higher magnification.
The picture above is from Indication 1 showing chained graphitization at higher magnification.
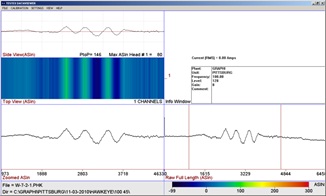
The waveform above is from indication 2 that was collected using a 45˚ HawkeyeDP.
The waveform above is from indication 2 that was collected using a circumferential HawkeyeDP.
Indication 2 showing chained graphitization through wall.
Indication 3 showing chained graphitization through wall.
The waveform above is from indication 3 that was collected using a 45˚ Hawkeye DP.
The waveform above is from indication 3 that was collected using a circumferential Hawkeye DP.
The waveform above is from indication 4 that was collected using a 45˚ Hawkeye DP.
The waveform above is from indication 4 that was collected using a circumferential Hawkeye DP.
The first picture above is from Indication 4 showing chained graphitization through wall.
The second picture is from indication 5 showing chained graphitization through wall.
The waveform above is from indication 5 that was collected using a 45˚ Hawkeye DP
The waveform above is from a visible crack that was collected using a circumferential Hawkeye DP.
The waveform above is from indication 6 that was collected using a 45˚ Hawkeye DP.
The waveform above is from indication 6 that was collected using a circumferential HawkeyeDP.
Indication 6 showing chained graphitization through wall
The waveform above is from indication 7 that was collected using a circumferential Hawkeye DP
The waveform above is from indication 8 that was collected using a circumferential Hawkeye DP.
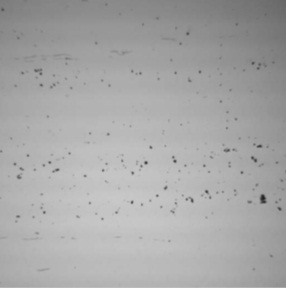
Graphite nodules as polished from Indication 8.
Graphite nodules as polished from Indication 8.
Indications 1 and 2
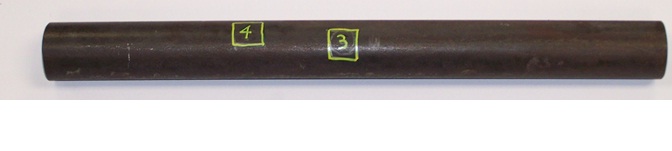
Indications 3 and 4
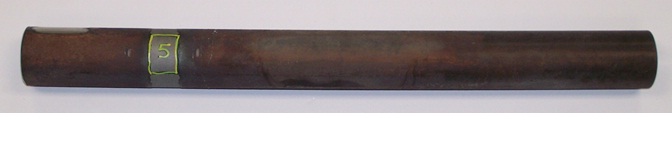
Indication 5. There was some uneven scale on the surface, so the location of the signal was sandblasted.
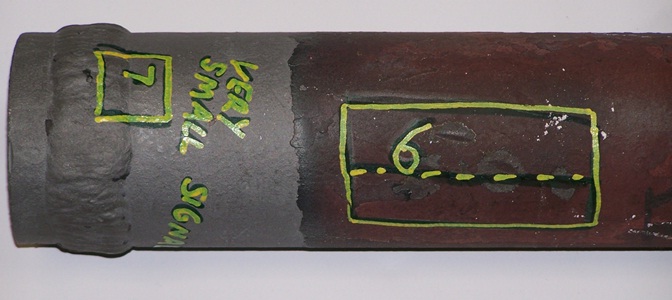
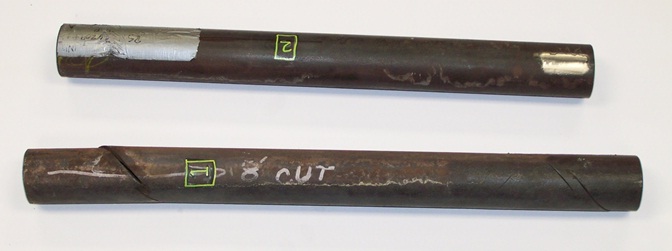
Indications 6 and 7. The area around the weld was sandblasted due to uneven scale on the surface.
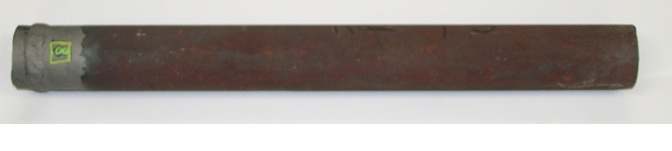
Indication 8. The area around the weld was sandblasted due to uneven scale on the surface.
If you would like to learn more about our inspections, our systems, or how they can be used on your site, please contact us at 412.798.8990 or click here.
Balanced Field Electromagnetic Technique Fundamentals:
The Balanced Field Electromagnetic Technique was developed to enhance the signal responses produced from smaller defects such as cracks. The technology was originally used to detect cracking from the outside surface to inspect welds in DA Tanks, pressure vessels, tube stubs, and any other areas suspected to have cracking. In this technique, electromagnetic coils are wound and arranged in a balanced state. This balanced state is achieved by placing coils in both the “x” and “z” geometries at zero potential to each other. With the excitation coil in the “x” geometry and the sensor coil in the “z” geometry, a differential signal is produced over defected areas. In detail, the alternating current produced by the excitation coil is uniform and undisturbed when no defects are present. Conversely, the current is interrupted when a defect is present and forced to travel around it in a distorted fashion. It is this state of distortion that causes the coils to become unbalanced and thus producing an indication for the user that signals a defect. This distortion signal response can be measured and a crack depth can be calculated by comparison to a calibration standard. The sizing of graphitization will be extremely difficult but some type of ranking is possible through the scanning some collected tube samples with graphitization. At minimum, the defects found can be ranked or classified according to the signal strength of the defect. Another key to the balanced field electromagnetic technique is the ability to eliminate liftoff (and/or probe wobble) and noise from the signal. This is accomplished through a special algorithm in which these unwanted elements are rotated away from the main signal.With the technology based on electromagnetics, a polished surface is not required. Quality readings can be acquired through coatings such as paint, epoxy, and rubber. The actual probe does not need to be in contact with the test piece. Sometimes the probe is placed in a small cart with the probe base set slightly above the test piece. The probe can be pulled quickly across the test specimen at a speed up to 1 foot per second. The BFET method can test different types of metal by adjusting the test frequencies which range from 100HZ to 30,000HZ.
During an inspection, the data is viewed in real-time on a computer screen. This allows defects to be found and located during the data collection process which allows a plant to quickly prove-up any suspect defects and to schedule repairs without having to wait for the completion of the job.
Findings
All six tubes were scanned initially with the 45˚ Hawkeye DP probe. This probe design allows circumferential and axial cracks to be detected. The circumferential Hawkeye DP probes were used to prove-up any defects found and also to test around the welds on the two Pittsburgh samples. The tests were performed at 100Hz. A total of 8 discontinuities were detected. Each area containing a discontinuity was marked with a square and labeled by a number. Some of the discontinuities gave a stronger response than others. TesTex did not have any calibration standards to size the responses from these discontinuities. The discontinuities are graded in a relative ranking from the strongest to weakest signal and are listed below. Indications 6, 7, and 8 are on the two Pittsburgh tubes and the remaining indications are on the Bowline samples.Indications 3, 6, and 8 showed the strongest signal response.
Indications 1 and 5 gave a moderate signal response.
Indications 2, 4, and 7 gave a small but distinguishable signal response.
A Metallurgical evaluation was performed on all eight indications and graphitization was found in each area. The table below lists the results of the metallurgical evaluation.
| Area Number | Station | Damage Present |
| 1 | Bowline | Chained graphitization through section |
| 2 | Bowline | Chained graphitization through section |
| 3 | Bowline | Chained graphitization through section |
| 4 | Bowline | Chained graphitization through section |
| 5 | Bowline | Chained graphitization through section |
| 6 | Bowline | Chained graphitization through section |
| 7 | Pittsburg | Chained graphitization at OD with scattered graphite nodules throughout |
| 8 | Pittsburg | Band of graphite midwall with scattered graphite nodules throughout |