ASME Power 2008 Condenser Inspection Paper
THE USE OF AN EDDY CURRENT INSPECTION OF BRASS TUBES IN A SURFACE CONDENSER TO PROVIDE A CONDITION ASSESSMENT
Shawn Gowatski
TesTex, Inc.
Pittsburgh, PA, USA
Tim Mitchell
Boralex Ashland
Ashland, ME, USA
Abstract
A Borelex, Inc. Power Plant in Ashland, Maine had a need to evaluate their Surface Condenser. The unit had 27 tubes that were previously plugged. The unit had steam impingement troubles in the past and the plant wanted to focus the inspection in this area. The condenser contains 6,084 tubes that are 7/8” OD, 0.049” wall, 303” long, admiralty brass. The plant decided to use the Eddy Current Technique (ECT) to inspect 600 tubes. The condenser uses local river water.TesTex told the plant the unit could be inspected and a color-coded tube sheet map showing the results could be completed in one shift. The contractor arrived at the plant at 7 am. The crew went through the usual plant indoctrination and safety training. Testing on the condenser using an Air-Assist System, the contractor was able to inspect the 600 tubes, perform analysis, and present a color-coded tube sheet map by 5 pm. A total of nine tubes showed wall thinning greater than 60%, which were recommended for plugging. The preliminary report provided listed the flaw locations and whether the defects were located on the I.D. or O.D. of the tube.
In addition to this inspection, the plant also performed a hydro-pressure test to find any additional tube leaks. A few more tube leaks were found in areas that were not inspected with eddy current. These leaks along with the 9 tubes recommended for plugging were plugged.
Prior to this inspection the plant felt the issues with the condenser were leaks in the joint between the tube and the tubesheet, where the tube has been rolled. The inspection showed the most severe wall losses found were on the O.D. of the tubes at various locations along the length of the tube. The tubes with wall losses less than 60% showed I.D. thinning at various places along the length of the tube. The effects of the tube plugging were that the water chemistry is better than ever and the vacuum pressure is higher than before.
Introduction
Boralex, Inc. in Ashland, ME suspected their condenser to be leaking due to poor water chemistry and low vacuum pressure. The plant was looking for a cost-effective way to inspect 600 of the tubes in one shift.Nomenclature
- ECT – Eddy Current Technique
- I.D – Inside Diameter
- KHz – kilohertz
- MW – megawatt
- NDT – Non-Destructive Testing
- O.D – Outside Diameter
The Ashland Boralex Power Plant is a Wood Residue Thermal Power Station. The plant was constructed in 1993 and has an output of 40MW.
The Surface Condenser is a single pass unit consisting of one water box containing 6,084 admiralty brass tubes. The tube dimensions are 7/8” O.D., 0.049” wall thickness, and 25’-3” in length. Prior to the October 2007 outage, the unit had 27 tubes mechanically plugged. Please note that a plugged tube is when a round metal insert is placed into the tube at both tubesheets and sealed. The plugs used in this condenser are expansion seal plugs. A surface condenser is used in power plants to condense the steam after it has gone through the tube. Water obtained from a reservoir or nearby river goes through the I.D. of the tubes and the condensing steam is on the shell side of the tubes. This condenser uses the local river water. The unit had steam impingement troubles in the past and the plant wanted to focus the inspection in this area. The condenser tubes are cleaned twice per year. The condenser tubes are cleaned using a highpressure washer with nozzles that blasts the silt and mud out of the tubes.
The plant suspected the condenser was leaking. An eddy current inspection performed on an identical condenser at a sister plant in Livermore Falls, ME showed issues at tube support plates. Using this information, the plant decided to perform an eddy current inspection on the tubes. The initial goal was to inspect 10% of the tubes.
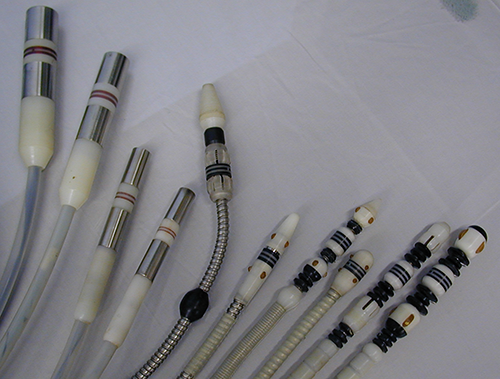
A brief explanation of the theory of Eddy Current Testing (ECT) is explained in the next few lines. Wall losses and pitting can be detected by injecting a high frequency magnetic field (1-1280KHz) into a tube and measuring the distortions in the resulting magnetic field that occur in a flawed region. A probe with circumferential coils is inserted into the I.D. of the tube. The probe is then excited to create the high frequency magnetic field. Flaws are detected by measuring the magnetic field directly under the flaw area with the coil. A flaw or defect causes the magnetic flux lines in that area to be distorted or different than expected. This distortion can be measured as a change in the horizontal and vertical components of the signal. With suitable calibration tables, flaws can be analyzed and a determination of the flaw depth can be made.
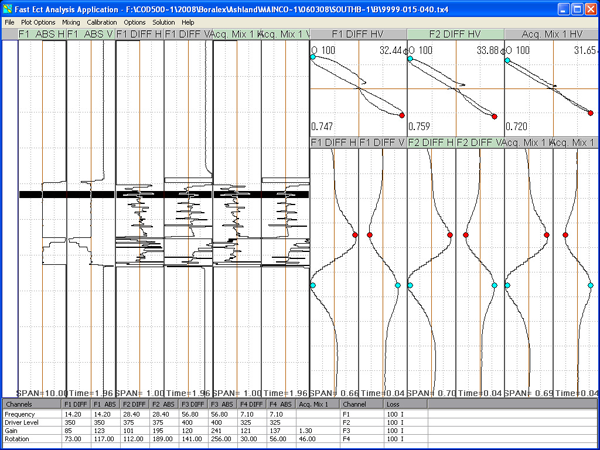
Calibration standards are used to provide accurate sizing of the defects found. The calibration standard needs to match the actual tubes in the unit that are being tested. The tube specifications include O.D., wall thickness, and metallurgy. ASME has set guidelines of the defects that should be on the calibration standard. The defects consist of an O.D. ring and an I.D. ring along with several O.D. pits of different depths. In addition to these defects, many companies also include general wall losses on their standard for accurate sizing of erosion. A properly set up calibration allows the technician to size the defects found and also report whether the defects are on the I.D. or O. D. of the tube. The technician sets the calibration up at four different frequencies that are used simultaneously during an inspection. The use of four frequencies eliminates false positives that may be detected in one or two frequencies but not all four frequencies. The multiple frequencies also aid in mixing out support and baffle plates.
High frequencies (>1 KHz.) are used in non-magnetic metal tubes because the low magnetic permeability of these materials presents little resistance to the penetration of the metal. By using high frequencies, the magnetic field produced has a very good signal to noise ratio while still penetrating the metal.
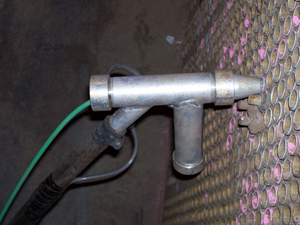
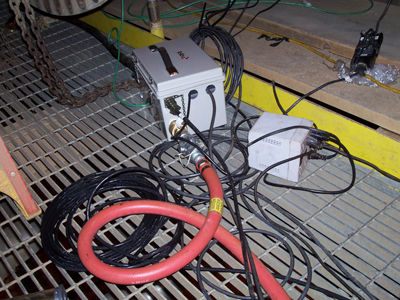
To save time and cost the “Air Assist System” was utilized. This system utilizes plant air as a motive force to push the probe through the tube quickly. With this system, the probe is still retrieved manually as data is collected. The Air Assist System can inspect approximately 2000 – 30’ long tubes per shift. This system can be used to inspect condensers, feedwater heaters, and other heat exchangers. The equipment is lightweight and easily transportable. This system allows for 100% inspections to be completed in a short amount of time during an outage. A preliminary report that includes a colorcoded tubesheet map is provided within hours of the completed testing.
The condenser tubes were cleaned prior to the inspection. The technicians arrived at the plant at 7am, and the crew went through the usual plant indoctrination and safety training. Upon completion of training, the crew set up the equipment, calibrated the system, and marked up the tubesheet for numbering identification. The technicians proceeded to inspect 600 tubes using their Air Assist System. The inspection crew was able to complete the testing and submit a color-coded tubesheet identifying the tubes with wall loss and also showing the location of plugged tubes.
The inspection identified 9 tubes with greater than 60% wall loss. The preliminary report identified the location of the defects and indicated if they were I.D. or O.D. defects. The worst nine tubes showed defects on the O.D. side of the tube. However, many other tubes showed I.D. pitting at wall losses in the range of 20-40%.
After the completion of the Eddy Current Inspection, the plant performed a hydro-pressure test. A total of 4 tubes were easily identified as leaking. These were located on the outside row of tubes. An additional tube was leaking, but it could not be identified due to being located deep into the bank of the tubes.
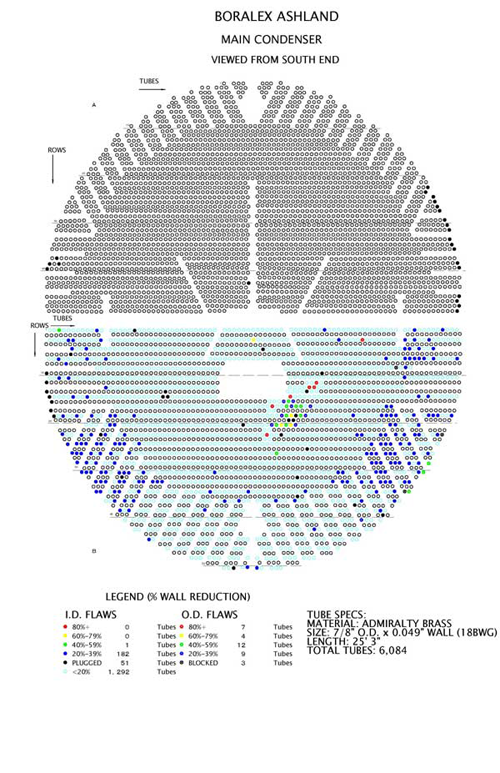
The plant plugged the four failed tubes plus the nine tubes identified as having greater than 60% wall loss. The water chemistry has greatly improved after plugging these tubes. The cost for water treatment chemicals dropped dramatically. The vacuum pressure has also improved. The plant had a shutdown starting in May 2008. The condenser was cleaned, and TesTex returned to inspect 1560 tubes using their Pusher/Puller System. The inspection focused on the bottom half of the unit. Every other row of tubes was inspected in this section. Once the Pusher/Puller ECT System was set-up, it took approximately seven hour to test the tubes, analyze the data, and present a preliminary report that included the color-coded tubesheet map shown in Figure 5. The color-coded tubesheet map is shown in Figure 5. Each circle represents a tube. The view is as one is looking at the South Tubesheet. The tubes colored in white were nottested. The black tubes are plugged. The light blue tubes showed less than 20% wall loss, dark blue showed 20-39% wall loss, green tubes showed 40-59% wall loss, yellow tubes showed 60-79% wall loss, and the red tubes showed greater than 80% wall loss. The map illustrates the location in the condenser where the most thinning is occurring.
Copyright © 2008 by ASME